When a website goes down, it often feels like a mystery inside a black box. Visitors see a spinning wheel, an error code, or a blank screen, but for IT teams and DevOps engineers, the first question is always the same: what broke?
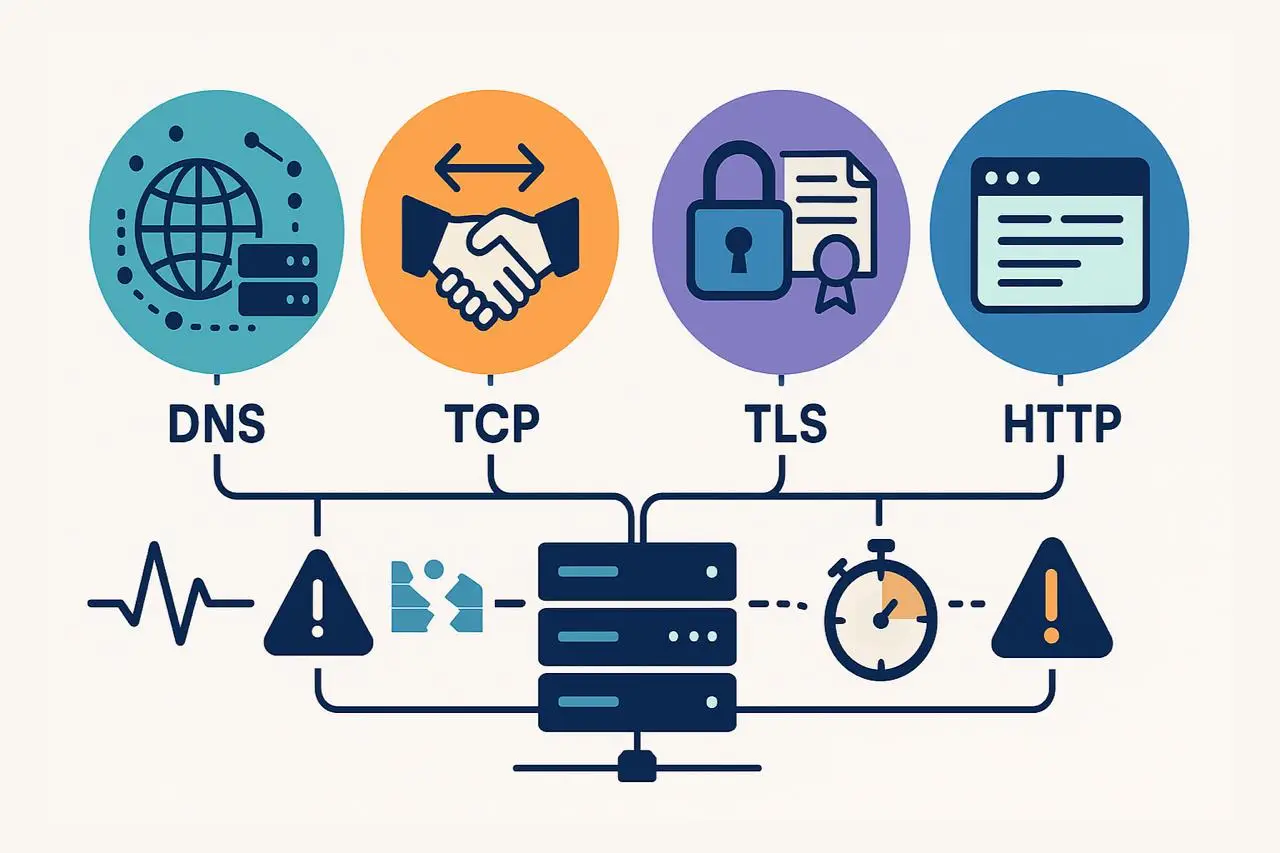
In reality, there isn’t just one way a website “goes down.” Every browser request goes through multiple stages—DNS resolution, TCP connection, TLS/SSL negotiation, and HTTP response—and each layer introduces its potential failure points. If a single link in the chain malfunctions, the entire user experience is disrupted.
That’s why modern website monitoring goes beyond simple uptime checks. Smart monitoring doesn’t just tell you a site is “down”; it pinpoints where the problem occurred.
- A DNS error points to domain or resolver issues.
- A TCP failure suggests connectivity or firewall problems.
- A TLS/SSL error indicates certificate or security issues.
- An HTTP 5xx response reveals server-side application errors.
By identifying which layer failed, your teams can respond faster, reduce mean time to resolution (MTTR), and resolve the right issue without wasted escalation or guesswork.
DNS Errors: The First Point of Website Failure
Every web request starts with DNS (Domain Name System) resolution, making it one of the most critical layers in the website delivery chain. When a user types your domain into a browser, the first action is a DNS lookup translating the domain name into an IP address that tells the browser where to connect.
If this step fails, nothing else can proceed. The browser won’t establish a TCP connection, validate a TLS/SSL certificate, or receive an HTTP response. In other words, DNS is the foundation, and when it breaks, your entire site goes dark.
That’s why DNS monitoring is often the first and most important indicator of a potential website outage. By catching DNS issues early, teams can prevent widespread downtime, avoid revenue loss, and maintain user trust before problems escalate.
Common DNS Errors and What They Mean
Because DNS is the first step in every website request, even minor issues here can cause major outages. Understanding common DNS error types helps teams pinpoint root causes faster and respond before downtime affects users.
Here are the most frequent DNS failures you’ll encounter—and what they indicate:
1. NXDOMAIN (Non-Existent Domain)
This error means the domain name doesn’t exist or cannot be resolved.
It’s often caused by:
- Expired or unregistered domains
- Misconfigured DNS zone files
- Typos in DNS records or CNAME entries
An expired domain can instantly take your website offline, while a small misconfiguration may break only a specific subdomain or service. Continuous DNS monitoring helps detect these issues early, especially after domain renewals or configuration changes.
2. SERVFAIL (Server Failure)
A SERVFAIL indicates that the authoritative DNS server could not process the query.
Common causes include:
- Corrupted or incomplete zone files
- Missing glue records
- DNSSEC validation errors
SERVFAIL responses often appear suddenly after system or configuration updates, making them an early warning sign of faulty deployments. Real-time DNS health checks can alert your team the moment these server-level issues occur.
3. DNS Timeouts
A timeout occurs when a DNS query receives no response within the expected time window.
Typical root causes include:
- Overloaded or unresponsive name servers
- Network latency or connectivity failures
- DDoS attacks overwhelming resolvers
Because DNS lookups happen before caching or content delivery, even a small delay can cascade into slower page load times and degraded user experience. Proactive global DNS monitoring—like that offered by Dotcom-Monitor—tests queries from multiple locations to detect these regional or provider-specific slowdowns before customers feel the impact.
How to Monitor DNS Effectively
Monitoring DNS health is more than verifying that your domain resolves once. To truly understand performance and reliability, monitoring should replicate how real users experience your website across different locations and networks.
Here’s how to implement comprehensive DNS monitoring:
Run Global DNS Checks
DNS performance can vary by geography. A record that resolves instantly from your local office might fail in another region due to anycast routing issues or regional network outages.
Use synthetic monitoring agents from multiple global locations to simulate real-world queries and detect region-specific issues before they impact users.
Tools like Dotcom-Monitor perform multi-region DNS resolution tests, identifying latency spikes, failed lookups, or inconsistent records in real time.
Track TTL (Time-to-Live) Behavior
Every DNS record includes a TTL value, which defines how long a resolver caches the record before re-querying.
While longer TTLs improve performance for end users, they can delay updates after configuration changes or migrations.
Monitoring tools should verify that updated values propagate correctly and that no stale DNS cache entries linger across regions.
Set Up Anomaly Detection and Alerts
The most valuable DNS monitoring insights come from trend analysis.
- A sudden increase in NXDOMAIN or SERVFAIL responses
- Rising DNS resolution latency
- Regional inconsistencies in response times
These are early indicators of deeper issues—often appearing hours before users report outages. Automated DNS anomaly alerts enable teams to react instantly, ensuring high uptime and faster recovery.
When DNS monitoring is properly implemented, it not only identifies root causes but also rules out what’s not broken.
If DNS resolution fails, you know TCP, TLS, and HTTP checks never even started. This clarity narrows your investigation quickly and helps teams engage the right vendors (DNS hosts, registrars, or network providers) for resolution.
TCP Connection Failures: When the Network Handshake Breaks
After DNS resolution successfully provides an IP address, the next stage in the website request chain is the TCP handshake—the digital “handshake” that establishes a communication channel between the client and the server.
This handshake follows a simple three-step process:
- The client sends a SYN (synchronize) packet.
- The server replies with a SYN-ACK (synchronize acknowledgment).
- The client sends back an ACK, completing the connection.
Only when this handshake completes can data start flowing between the browser and the web server.
When TCP fails, the browser knows where to locate the server (thanks to DNS) but cannot connect to it. The result feels like a black hole; pages hang indefinitely, sockets remain closed, and users see endless loading spinners.
DNS failures, which tend to be immediate and obvious, and TCP connection issues often cause partial outages; the site may appear up for some users and unreachable for others. These inconsistencies make TCP monitoring a crucial layer of any website performance and uptime monitoring strategy.
Common TCP Errors and What They Indicate
Once the TCP handshake process begins, several network-related failures can occur that prevent successful communication between client and server. Understanding these TCP error types helps teams quickly diagnose where the connection is breaking down and which system component (network, firewall, or application) needs attention.
Below are the most common TCP connection errors and what they typically mean:
1. Connection Refused
This error means that the client successfully reached the target host, but no service was listening on the expected port.
Common causes include:
- Web or application services crashing unexpectedly
- Containers or virtual machines being terminated or redeployed
- Misconfigured load balancers or port bindings
A simple example: a web server that isn’t bound to port 443 (HTTPS) appears “down” even if the underlying server is running fine.
Best Practice: Use TCP port monitoring to confirm services are bound correctly and listen across all instances. Dotcom-Monitor can continuously test port availability and alert your team when a service stops responding.
2. Connection Timed Out
A TCP timeout occurs when packets are lost or blocked somewhere along the route to the destination.
Typical root causes include:
- Firewalls silently dropping packets
- Network path congestion or instability
- Routing misconfigurations or ISP-level issues
Timeouts can be especially frustrating because they offer no immediate diagnostic feedback; users simply see a spinning wheel until the client gives up.
Best Practice: Implement TCP path monitoring with tools that trace network hops and latency. Dotcom-Monitor’s network diagnostics visualize packet flow to pinpoint exactly where timeouts occur.
3. Connection Reset
This happens when a TCP handshake completes but is abruptly terminated.
Frequent causes include:
- Overloaded proxies or servers closing connections early
- Aggressive idle timeout settings on load balancers
- Security middleboxes (like WAFs) rejecting perceived suspicious sessions
Resets often appear as intermittent errors that are difficult to reproduce, especially in distributed architectures or CDN environments.
Best Practice: Use continuous TCP performance monitoring to detect reset patterns and correlate them with load, security policies, or specific proxy behaviors.
By categorizing errors this way, teams can quickly narrow the issue’s scope:
- If TCP fails, DNS resolution works, but the connection can’t be established.
- This clarity reduces troubleshooting time and directs the fix to the right team, network, firewall, or infrastructure ops.
How to Monitor TCP Effectively
Basic uptime checks like simple ICMP pings often create a false sense of security. A server may respond to pings but still fail to complete a TCP handshake, meaning users can’t actually connect to your website or application.
True TCP monitoring goes deeper, validating real-world connection behavior and detecting issues that basic ping tests miss. Here’s how to do it right:
1. Handshake Validation
Effective TCP monitoring begins with validating the SYN/SYN-ACK/ACK handshake on the actual service port (e.g., 80 for HTTP or 443 for HTTPS).
This ensures that the server is reachable and actively listening for traffic, not just alive at the network layer.
Best Practice: Use synthetic monitoring tools, such as Dotcom-Monitor’s Network Monitoring, to automatically attempt full TCP handshakes and confirm that each service endpoint responds correctly across all nodes.
2. Path Analysis Across Regions
A successful handshake depends on every link in the connection path. Using traceroutes or MTRs (My Traceroute) from multiple geographic regions reveals where packets slow down or stop, whether that’s in your data center, at a CDN edge, or upstream with your ISP.
Best Practice: Run geo-distributed TCP path checks to detect routing or congestion issues early. Dotcom-Monitor’s global monitoring network makes it easy to identify regional anomalies before they impact users.
3. Protocol Parity (IPv4 and IPv6 Monitoring)
Many organizations now support both IPv4 and IPv6, but real-world incidents can affect one protocol and not the other. If you only test IPv4, you could miss user-facing issues that occur on IPv6 networks.
Best Practice: Always include both protocols in your monitoring setup. With Dotcom-Monitor, you can run dual-stack checks to ensure consistency and detect parity problems across connection types.
Why TCP Monitoring Matters
DNS or HTTP checks and TCP monitoring verify that your servers are ready to accept live traffic—not just powered on. If TCP fails, it means DNS resolution worked, but the network connection could not be established.
This insight helps your team triage issues instantly:
- DNS is fine → focus on server, firewall, or load balancer.
- No need to escalate to developers or application teams unnecessarily.
By implementing layered TCP monitoring, organizations gain faster incident response, reduced downtime, and higher network reliability.
TLS/SSL Errors
In today’s web landscape, HTTPS is no longer optional—it’s the default. After the TCP handshake, a browser and web server initiate a TLS (Transport Layer Security) session to secure the connection.
TLS serves two critical functions:
- Encryption: It protects all data transmitted between the browser and server from interception.
- Authentication: It verifies that the server is legitimate by validating its digital certificate.
Without TLS, users face major security and privacy risks. But even with it, misconfigurations or expired certificates can cause major issues.
When TLS fails, users see frightening browser warnings like “Your connection is not private” or “This site’s certificate is invalid.” These messages erode trust immediately—and in many cases, block users from proceeding altogether.
That’s why TLS/SSL monitoring is critical for maintaining both uptime and credibility. A single expired certificate can take your website offline and damage your reputation overnight.
Why TLS/SSL Errors Happen
TLS problems often stem from misconfigurations or missed renewals. Common causes include:
- Expired Certificates – Certificates that aren’t renewed before expiration will immediately trigger security errors, blocking access.
- Hostname Mismatch – Occurs when a certificate was issued for one domain (e.g., www.example.com) but is used on another (e.g., api.example.com).
- Untrusted Certificate Authority (CA)—Browsers don’t recognize the CA because it’s self-signed or chained to a private root certificate not installed on the client device.
- Handshake Failures—The cryptographic negotiation between client and server fails, often due to unsupported cipher suites, deprecated protocol versions, or incomplete certificate chains.
Each of these errors affects user trust and accessibility, which is why continuous TLS monitoring is essential for early detection.
How to Monitor TLS/SSL Effectively
TLS certificates don’t fail gradually; they work perfectly one day and break the next. The best monitoring approach is proactive and automated.
Here’s how to implement reliable TLS monitoring:
1. Track Certificate Validity
Monitor the expiration date of all SSL/TLS certificates across your domains and subdomains. Set multiple alert thresholds (e.g., 30, 7, and 1 day before expiry) to ensure renewal happens on time.
2. Validate the Full Certificate Chain
Incomplete or misconfigured certificate chains can break trust even if the main certificate is valid. Regularly test certificate chains from different regions to catch CA or intermediate certificate issues before users encounter them.
3. Check Protocol and Cipher Compatibility
As browsers deprecate older protocols (like TLS 1.0/1.1), maintaining compatibility becomes critical. Monitoring tools should validate supported cipher suites and protocol versions to ensure users aren’t locked out.
4. Watch for Handshake Failures
A sudden increase in TLS handshake errors often indicates misconfigured load balancers, expired intermediates, or network-level issues.
Why TLS Monitoring Matters
TLS errors aren’t just technical problems; they’re business-critical. They directly impact user trust, brand perception, and conversion rates.
When your TLS monitoring alerts you to certificate or handshake problems early, your team can act fast before they escalate into user-facing incidents.
Common TLS/SSL Errors
TLS (Transport Layer Security) and SSL (Secure Sockets Layer) errors are among the most visible and reputation-damaging issues a website can face. When they occur, users are greeted with browser warnings like “Your connection is not private” or “This website’s security certificate has expired.” These alerts immediately break trust and can stop users from visiting your site entirely.
Below are the most common TLS/SSL errors, their causes, and why continuous monitoring is vital for prevention.
Expired Certificate
An expired SSL certificate is one of the leading causes of HTTPS outages. Certificates are issued for a limited validity period (usually 90 days to a year). If they aren’t renewed before expiry, browsers will flag the website as insecure and block access.
Why It Happens:
- Failure to automate renewals
- Certificate renewal didn’t propagate to all servers
- Misconfigured load balancers or caching issues
Hostname Mismatch
A hostname mismatch occurs when the domain name in the certificate doesn’t match the URL users are visiting. For example, a certificate issued for www.example.com will not validate if a user visits api.example.com.
Why It Happens:
- Adding new subdomains after certificate issuance
- Moving services behind a CDN or proxy without reissuing certificates
- Incorrect SAN (Subject Alternative Name) configuration
Untrusted Certificate Authority (CA)
If the certificate authority (CA) isn’t recognized or trusted by the browser, users will see a “certificate not trusted” warning. This happens when a certificate is self-signed, issued by an internal CA, or chained to an outdated or missing intermediate certificate.
Why It Happens:
- Self-signed certificates used in production environments
- Private root certificates not installed on client devices
- Missing or invalid intermediate certificates
Handshake Failure
A TLS handshake failure occurs when the browser and server can’t agree on how to securely connect. The handshake process ensures both parties support the same encryption protocols and ciphers.
Why It Happens:
- Deprecated or unsupported cipher suites
- Using outdated TLS versions (like 1.0 or 1.1)
- Incorrect certificate chain configuration or missing intermediates
Ensure Your Website Never Fails a TLS Handshake Again
With Dotcom-Monitor’s TLS/SSL Monitoring, you can automatically detect certificate errors, handshake issues, and expired SSLs before they impact your users or reputation.
How to Monitor TLS
TLS (Transport Layer Security) monitoring needs to be proactive, automated, and continuous. Certificates don’t degrade gradually; they work perfectly one day and block access the next. That’s why effective TLS/SSL monitoring is a critical part of any website monitoring strategy.
Below are the key practices to ensure your certificates never cause unexpected downtime or trust issues:
Track Certificate Validity and Expiration
Certificates expire without warning, and when they do, users immediately see browser errors blocking access to your site. To prevent this, monitor certificate expiration dates continuously and set up alerts well before expiry—ideally at 30 days, 7 days, and 1 day before the deadline.
Validate the Full Certificate Chain
A valid SSL certificate is only as strong as its chain of trust. Even if the leaf certificate is valid, missing intermediate certificates can break trust for users in certain browsers or regions.
Regularly validate the entire certificate chain from multiple global locations to detect regional inconsistencies early.
Check Protocol and Cipher Compatibility
Web browsers frequently phase out old protocols (like TLS 1.0 and 1.1) and weak ciphers for security reasons. If your server still relies on deprecated configurations, users may be unable to connect securely.
Monitor for Handshake Failures and Latency
TLS handshakes are the foundation of encrypted communication. When they fail or take too long, users experience delays, timeouts, or outright connection errors.
Spikes in handshake errors often trace back to load balancer misconfigurations, expired intermediates, or new CDN rollouts.
Automate Certificate Management
The best way to prevent certificate-related outages is automation. Treat certificates like code: renew them automatically, deploy updates consistently across environments, and monitor expiration just as aggressively as you monitor disk space or CPU usage.
HTTP Errors
After DNS, TCP, and TLS have successfully done their jobs, the browser finally sends an HTTP request to the web server. The server then responds with an HTTP status code 200 OK when everything is functioning normally or an error code when something goes wrong.
Monitoring these HTTP responses is often what people first imagine when they think of website uptime monitoring. However, monitoring these HTTP responses is just a single aspect of website uptime monitoring. Without context from earlier layers (DNS, TCP, and TLS), HTTP monitoring can reveal what failed, but not why it did. That’s why advanced web application monitoring needs to look deeper beyond availability into performance, response codes, and transaction integrity.
Common HTTP Errors
Here are some of the most frequent HTTP issues that affect website uptime and user experience:
- 404 Not Found: The requested page or resource doesn’t exist. This could be caused by broken links, deleted pages, or routing misconfigurations.
- 500 Internal Server Error: The server encountered an unexpected condition—often due to bugs in application code, faulty configurations, or overloaded processes.
- 502 Bad Gateway: A proxy or load balancer received an invalid response from an upstream server. This is common in distributed or microservices-based environments.
- 503 Service Unavailable: The server is temporarily unable to handle requests, usually due to maintenance or capacity limits being reached.
- 504 Gateway Timeout: An upstream service took too long to respond, causing the request to fail before a response could be sent back to the user.
Each of these errors affects user trust and conversions, and in most cases, your customers won’t know (or care) why. They’ll just leave.
How to Monitor HTTP
Effective HTTP monitoring goes far beyond checking if your homepage loads. It should verify response codes, response times, and transaction success rates across every layer of the web experience.
Key best practices include:
- Synthetic Transactions: Simulate real user interactions such as logging in, adding an item to a cart, or completing a checkout to ensure full workflows are functional.
- Response Code Tracking: Automatically capture and alert on any responses outside the 200–299 range to quickly detect server-side or application-level failures.
- Performance Thresholds: Monitor response times and page load speeds globally. Even if a site is “up,” slow performance can drive users away.
- Global Monitoring Locations: Run HTTP checks from multiple geographic regions to identify latency, CDN issues, or routing bottlenecks that affect global audiences.
Why HTTP Monitoring Matters
Monitoring HTTP isn’t just about confirming uptime; it’s about understanding application health and user experience. A site that responds slowly or inconsistently costs you traffic, conversions, and SEO rankings. By layering HTTP monitoring on top of DNS, TCP, and TLS checks, you gain full visibility into where problems originate, whether it’s your code, infrastructure, or an upstream dependency.
Common HTTP Errors
When monitoring website uptime and performance, HTTP response codes reveal the outcome of each user request. Understanding these common HTTP errors helps you pinpoint whether issues lie in your application, server, or upstream dependencies.
- 404 Not Found: Indicates that the requested resource or page does not exist. This typically results from broken links, deleted content, or incorrect URL routing. Regular HTTP monitoring helps detect these errors early to preserve SEO and user trust.
- 500 Internal Server Error: A generic server-side failure, often caused by application bugs, server misconfigurations, or overloaded backend processes. Monitoring HTTP response logs can quickly identify recurring 500 errors before they impact users.
- 502 Bad Gateway: Occurs when a proxy, CDN, or load balancer receives an invalid response from an upstream server. This is common in distributed or microservice environments where one component fails to communicate properly with another.
- 503 Service Unavailable: Signals that the server is temporarily unable to process requests, usually due to scheduled maintenance, resource exhaustion, or traffic spikes. Proactive monitoring helps teams identify and mitigate overload conditions before downtime spreads.
- 504 Gateway Timeout: Happens when an upstream server takes too long to respond, causing the gateway or proxy to time out. This can indicate latency, database bottlenecks, or dependency slowdowns within your application stack.
Putting It All Together: A Layered Error Monitoring Strategy
Modern website monitoring isn’t just about detecting downtime—it’s about understanding why a site is down and which layer caused the failure. Each step in the connection sequence—DNS, TCP, TLS, and HTTP — plays a distinct role, and each can fail independently.
Every outage occurs in order:
- If DNS fails, no connection can be made.
- If TCP fails, DNS resolution works, but the network handshake doesn’t.
- If TLS fails, the encryption setup or certificate validation breaks.
- If HTTP fails, all previous layers succeeded—meaning the issue lies in the application or server.
This layered approach provides clarity and precision in diagnosing web performance and availability issues.
The Four Layers of Comprehensive Error Monitoring
- Start with DNS Checks: Verify that domains resolve correctly from multiple global locations.
- Add TCP Connection Monitoring: Confirm that servers accept and respond to connection requests.
- Layer TLS Certificate Monitoring: Track SSL certificate validity, handshake performance, and chain trust.
- Finish with HTTP Response Monitoring: Measure actual uptime, latency, and response codes.
Faster Root-Cause Analysis
By aligning monitoring with these layers, your team can pinpoint the exact failure point—and the right owner to fix it:
- DNS error? Contact your DNS hosting provider.
- TCP error? Escalate to your network or hosting provider.
- TLS error? Check certificate validity or edge configurations.
- HTTP error? Alert your application or DevOps team.
Instead of a vague “website is down” alert, you get actionable insights that reduce Mean Time to Resolution (MTTR) and eliminate the guesswork between teams.
Conclusion
Websites don’t just fail; they fail in layers. Every outage begins at a specific point in the connection chain: DNS, TCP, TLS, or HTTP. Each layer introduces its own risks, behaviors, and failure signatures.
By adopting error-type monitoring, you turn complexity into clarity, transforming a generic “site is down” alert into precise, actionable insights.
With a robust website monitoring strategy powered by tools like Dotcom-Monitor, you gain more than uptime data; you gain understanding. You’ll know why your site is down, which layer caused it, and who needs to fix it. Whether it’s a DNS issue requiring registrar action, a TCP timeout from your hosting provider, or a TLS certificate expiration, you’ll pinpoint the root cause fast before users even notice.
Ultimately, error-based monitoring isn’t just about keeping your site up; it’s about accountability, visibility, and speed. The next time your website experiences an issue, don’t settle for uncertainty. Know exactly what broke, why it broke, and how to resolve it with confidence and clarity.
Ready to monitor your website the smart way?
Detects DNS, TCP, TLS, and HTTP issues before your users do.
Frequently Asked Questions
Monitoring website errors by type refers to tracking and analyzing website failures based on the specific layer of the connection process—DNS, TCP, TLS, or HTTP. Each error type reveals a different root cause:
- DNS errors signal issues with domain name resolution.
- TCP errors indicate failed or slow network connections.
- TLS/SSL errors point to certificate or encryption problems.
- HTTP errors highlight web server or application failures.
By using multi-layer website monitoring tools like Dotcom-Monitor, teams can detect where and why downtime occurs, improving website uptime, performance, and reliability while reducing troubleshooting time.
Multi-layer website monitoring is essential because websites don’t just go down for one reason—they fail across different layers of the internet stack. Traditional uptime checks only tell you if a site is “up” or “down,” but not why.
Layered monitoring across DNS, TCP, TLS, and HTTP gives complete visibility:
- If DNS fails, your domain can’t be found.
- If TCP fails, the network handshake breaks.
- If TLS fails, users face SSL certificate errors and browser warnings.
- If HTTP fails, your web application or server is malfunctioning.
This approach ensures faster root-cause analysis, improved uptime monitoring, and better user experience, all of which are crucial for business-critical websites.
Dotcom-Monitor provides advanced website performance and uptime monitoring tools that replicate real-user interactions from multiple global locations. It continuously tests every layer of the connection to ensure reliability:
- DNS Monitoring: Checks global domain resolution speed and availability.
- TCP Monitoring: Verifies successful handshakes and detects connectivity issues.
- TLS/SSL Monitoring: Tracks SSL certificate validity, expiration, and encryption strength.
- HTTP Monitoring: Measures uptime, page speed, and error response codes.
With real-time alerts and visual diagnostics, Dotcom-Monitor enables IT and DevOps teams to identify the exact cause of downtime—whether it’s a DNS timeout, TCP connection issue, TLS handshake failure, or HTTP 500 error—and resolve it before it impacts users or SEO rankings.