Advanced Web API Monitoring for Reliable, Fast Integrations

Advanced Web API Monitoring for Reliable, Fast Integrations
⭐ G2 Top Performer | SOC 2 Type II | 99.99 % Uptime SLA | ISO 27001 Certified
Trusted by 10,000+ Organizations Worldwide​
Website monitoring leader since 1998
aflac logo
dell logo
comcast logo
dish logo
citrix logo

What Is Web API Monitoring?

Web API monitoring is the continuous process of testing and analyzing the availability, performance, and functionality of Application Programming Interfaces (APIs) to ensure they operate as expected. It verifies that APIs are accessible, responsive, and return correct data, while tracking key metrics like uptime, latency, throughput, and error rate.

Effective API monitoring helps DevOps, QA, and SRE teams detect issues early, validate integrations, and maintain reliable communication between services, databases, and applications, critical for smooth digital experiences and business continuity.

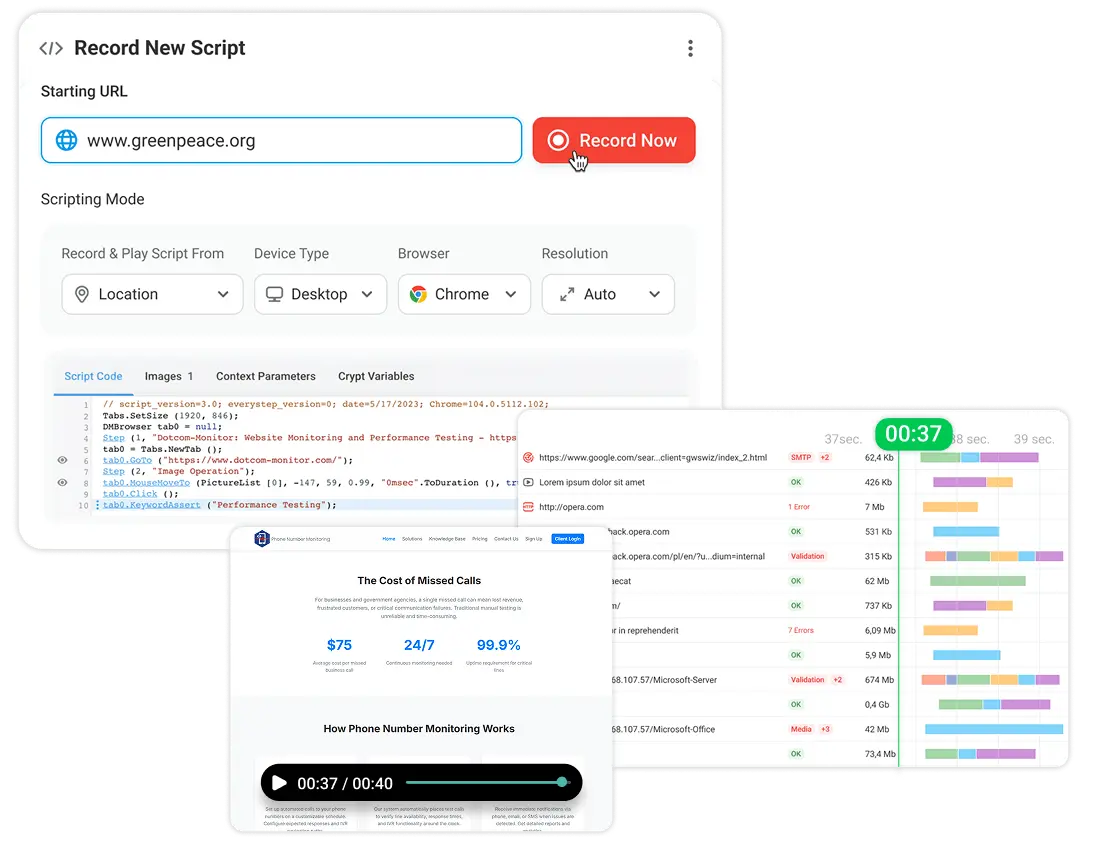
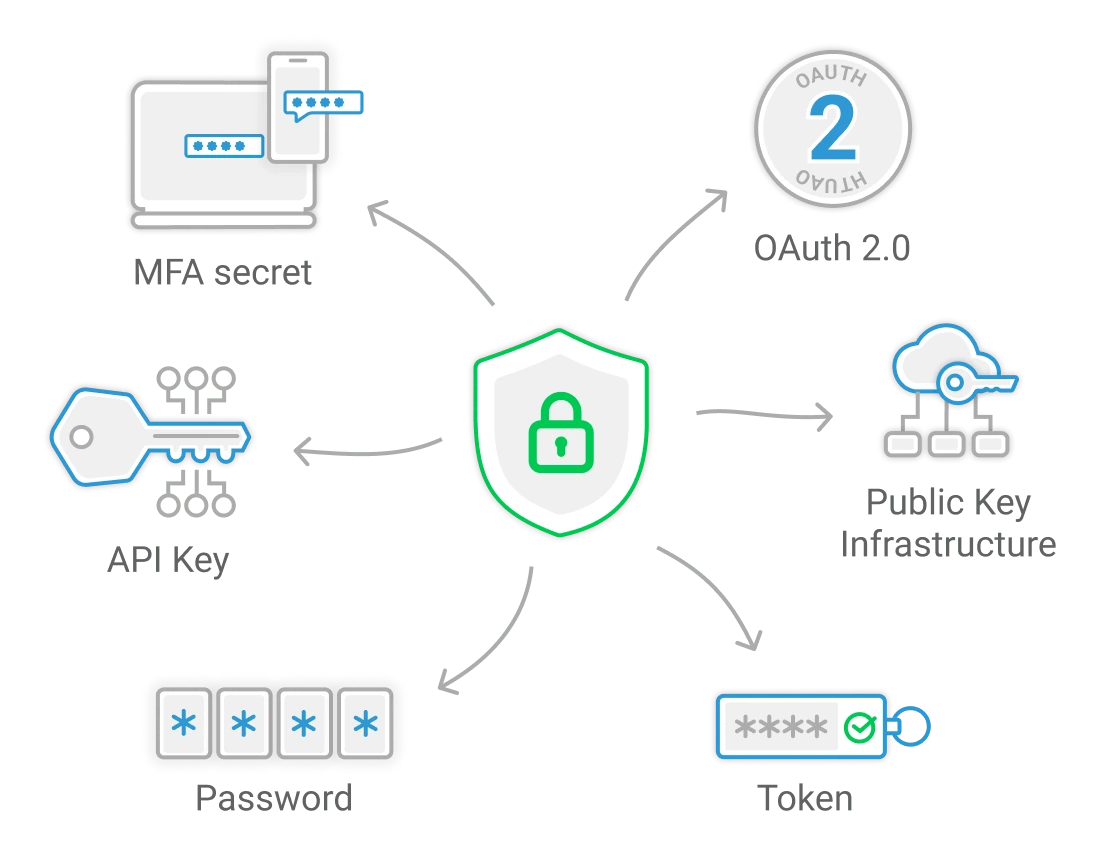
Dotcom-Monitor’s Web API Monitoring platform takes this a step further with synthetic monitoring, executing simulated customer workflows to test endpoints from global probe locations. The platform validates every response against assertions (e.g., authentication, token validation, data integrity), captures real-time metrics on performance and security, and pinpoints failures before they impact users.

By combining functional, performance, and compliance monitoring, Dotcom-Monitor empowers engineering teams to:

				
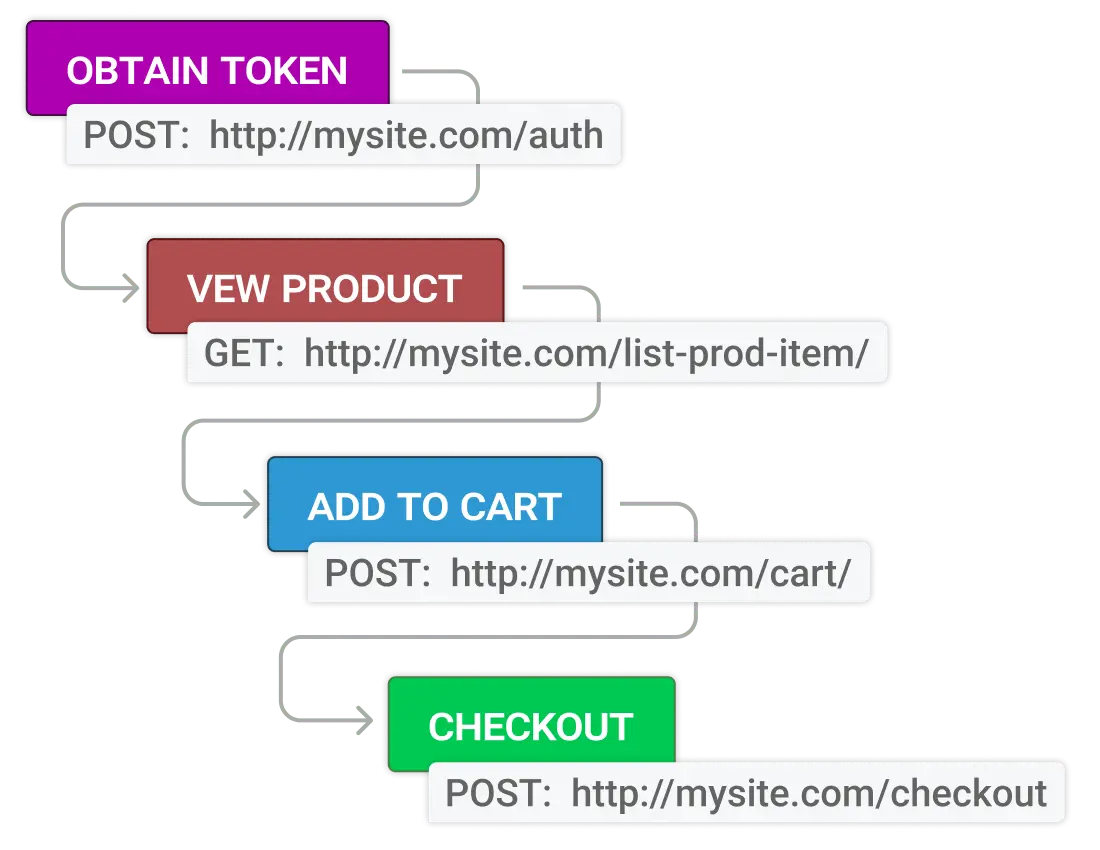
					Example: A simulated flow might test POST /login → GET /cart → POST /order and confirm 200 status with a valid JSONPath response—ensuring the entire workflow executes flawlessly.


Key Metrics & SLOs

Measure what matters to keep APIs healthy and predictable:

💡 Use the API SLO & Error Budget Calculator to compute downtime allowances and alert thresholds. For more on SLO practices, explore Google SRE Guide — an authoritative reference on SLO and error-budget concepts.
API SLO dashboard displaying p95 latency, uptime, and error-budget metrics

Multi-Step Transaction Monitoring

API-Level Multi-Step Monitoring

API-Level Multi-Step Monitoring

Replicate complex, dependent API flows to catch issues that single-step checks miss. Dotcom-Monitor simulates chained API calls that mirror real-world backend workflows, helping you detect data propagation errors, authentication timing issues, and dependency failures before users notice.

Example flow:

				
					POST /login → token → POST /orders → GET /orders/{id} → validate JSONPath → DELETE /orders/{id}


Browser-Based Transaction Recording

For full-stack visibility, use the EveryStep Recorder to record multi-step browser transactions that reflect true user interactions.

Simulate login, checkout, and data submission flows across browsers and geographies. Then correlate browser metrics with API-level performance to isolate bottlenecks faster.

On failure, access video recordings for instant visual context, and drill down to root causes in seconds.

multi-step API monitor flow in EveryStep Recorder showing chained requests, assertions, and timing
Build your first multi-step API or browser transaction monitor
💡 Note: Both monitoring types complement each other; API-level checks ensure backend reliability, while browser-based recording validates full end-to-end user experiences.

Auth & Security Matrix

Modern APIs require secure, realistic authentication to mirror production behavior. Dotcom-Monitor supports multiple authentication standards, including API Key, Basic, and OAuth 2.0 (client credentials and refresh).

API key, Basic, and OAuth 2.0 authentication methods supported in Dotcom-Monitor point-and-click scripting Platform with Secure Vault protection.

All sensitive data, such as tokens, credentials, and headers, is securely stored and masked using Secure Vault, ensuring they remain protected during test creation and playback.

Resilience & Scale

Modern web environments demand reliability across both web applications and APIs. Dotcom-Monitor’s distributed point-and-click scripting Platform architecture replicates real-world latency, regional failure patterns, and load variations — ensuring performance consistency from front-end transactions to backend API dependencies.

This cross-layer approach ensures that both browser-based web interactions and API-dependent transactions are tested under realistic network and geographic conditions, mirroring true user experiences at scale.

Explore the point-and-click scripting Platform Overview to see how distributed agents and multi-task monitors replicate live traffic patterns across APIs and web applications.

Global network of Dotcom-Monitor probe locations showing latency zones and failover coverage for web applications and APIs.

Metrics & Reporting Integrations

Export and visualize your monitoring data anywhere using Dotcom-Monitor’s flexible XML feed. Our feed lets you stream uptime, latency, and error metrics into your preferred visualization tools—such as Grafana, Prometheus, or any custom dashboard—giving your team full control over how API performance data is analyzed and shared.

Grafana dashboard visualizing Dotcom-Monitor XML feed metrics for latency, uptime, and error trends.

For implementation guidance, refer to our guides on Using XML Reporting Services and Custom Metrics Analysis.

💡 OpenTelemetry integration is planned for future release to further enhance native observability support.

CI/CD & Monitors-as-Code

Shift-left API monitoring by embedding it in your CI/CD pipelines. Define monitors as YAML or Terraform modules and automatically block releases when SLOs fail.

Read the CI/CD Integration Setup.

AML monitor-as-code example for API monitoring pipeline with SLO validation
Slack incident alert from Dotcom-Monitor API monitoring with error details and runbook link

Alerting & Incident Workflow

Dotcom-Monitor provides instant alert routing via Slack, Microsoft Teams, PagerDuty, Webhooks, SMS, or Email.

Each alert includes diagnostic context, response payloads, and trace IDs to accelerate incident response.

Learn configuration steps in Alerting Documentation.

Integrations Matrix

Dotcom-Monitor connects seamlessly with popular third-party tools to extend alerting, collaboration, and workflow automation. Supported integrations include Microsoft Teams, Slack, Jira, ServiceNow, PagerDuty, Dynatrace, and Azure DevOps, along with other ecosystem connectors via webhooks and REST API.

Additional integrations are available via the Third-Party Services Integration Knowledge Base and the Integrations Hub.

Dotcom-Monitor integrations including Microsoft Teams, Jira, ServiceNow, PagerDuty, and Azure DevOps.

API Monitoring Success Stories

Real-world performance gains from customers using Dotcom-Monitor.

API monitoring case study showing latency reduction and uptime improvement

Malcolm Group (e-commerce platform)

Using Dotcom-Monitor’s EveryStep Web Recorder, they built a full checkout flow script that:

LuckyVitamin (Global e-commerce retailer)

To support millions of monthly visitors across 50+ countries, LuckyVitamin implemented Dotcom-Monitor’s synthetic and performance testing to safeguard their checkout experience.

Using real-time alerts and trend analytics, they uncovered hidden bottlenecks that saved hundreds of engineering hours, protecting thousands in potential lost revenue, and scaling through 3–4× peak demand with confidence.

Reference: Custom Metrics Analysis in Web App Monitoring

Web API Monitoring Tools Competitive Comparison

Feature
Dotcom-Monitor
Postman
Middleware
Moesif
Uptrends
Multi-Step Depth
✅ Full flows with assertions
Partial
Partial
Basic
Advanced
Auth Types
OAuth2, JWT, and basic
Basic
Basic
Limited
Basic
Geo/DNS Checks
✅ Global network
SLO/Error Budgets
✅ Calculator
Monitors-as-Code
✅ YAML/Terraform
Runbooks/Status
Trial/Pricing
30-Day Free Trial
Paid
Freemium
Freemium
14 Days

View Our Latest Comparison For Best Web API Monitoring Tools In 2025

DevOps team monitoring API performance with Dotcom-Monitor dashboard

Choosing the Right Web API Monitoring Tool

Learn about pricing tiers in multi-step monitoring Pricing

Expert Overview

APIs are the connective tissue of every digital ecosystem; when they fail, entire user experiences are disrupted.

At Dotcom-Monitor, we combine synthetic and multi-task monitoring, Secure Vault protection, and flexible XML data feeds to give engineering teams a unified view of their systems’ health.

By modeling SLA and SLO thresholds across geo-distributed probes, teams can identify latency patterns, prevent regressions before release, and maintain high performance at scale.”

— Dotcom-Monitor Engineering Team

Dotcom-Monitor engineering team providing expert insights on API performance monitoring.
Build your first multi-step API or browser transaction monitor
💡 Note: Both monitoring types complement each other; API-level checks ensure backend reliability, while browser-based recording validates full end-to-end user experiences.

Learn More About Web API Monitoring Tool Features

Explore these feature-level guides to see how each capability contributes to reliable, high-performance web APIs. Each link opens a deep dive explaining setup steps, use cases, and integration options for your monitoring stack.

Explore REST API Monitoring
Learn About OAuth Authentication Checks
Validate Data with Assertions Monitoring
Track Availability in Uptime & SLA Reports
Build Multi-Step Transaction Monitors
Automate Deployments with CI/CD Integration
Respond Faster with Alerting & Incident Workflows
Export Custom Metrics & Reporting Data
Monitor Dynamic Web Apps (SPA)
Get answers

Frequently Asked Web API Monitoring Questions

API monitoring tests the availability, performance, and accuracy of web services.

See Glossary: Web API Monitoring

Dotcom-Monitor, Postman, Uptrends, and Moesif lead the space; Dotcom-Monitor adds multi-step flows and SLA reports beyond basic checks.

Create an API monitor in the Dotcom-Monitor platform by specifying your API endpoint, request method, and expected response. The monitor will automatically test your API at regular intervals and alert you if it becomes unavailable or responds slowly. Use EveryStep Recorder to simulate user transactions.

Testing validates development builds; monitoring ensures live reliability.

See API Testing vs Monitoring Comparison

Synthetic offers controlled, repeatable checks; RUM provides real-user analytics.

Combine both for holistic visibility.

Configure authorization headers in Monitors-as-Code templates. Reference Authentication Setup Guide.

Yes — OpenTelemetry Exports enable streaming of metrics to Grafana and Prometheus.

Alerts can be delivered through multiple channels depending on your setup and selected Delivery Address Group. Dotcom-Monitor supports: Email, Phone, SMS, SNMP, Wireless Email, PagerDuty, Zapier, Slack, Microsoft Teams, HTTP Webhooks, Status.io Integration, ServiceNow, WhatsApp, and Mobile Push Notifications. For configuration details, see Alert Delivery Mechanisms.

Pricing Peek & Trial Terms

Enjoy a 30-day free trial with all features enabled — no credit card required. Choose from plans based on monitoring locations, frequency, and user seats. View Pricing.

Free

Free Forever

$0

Key Features

Subscriptions

Starting at

$19

.99 /mo

Everything in Free, plus

Enterprise

Custom Pricing

Let’s talk

Everything in Subscriptions, plus

All-in-One Web API Monitoring | Simple. Powerful. Proven.

No credit card required. All premium features included. 24×7 expert support.