An icon in the Twin Cities triathlon community, Jerry Bous, has a website problem that’s good to have. He has been able to parlay his love for the sport of triathlon into an occupation as THE triathlon race announcer as well as owner of the very popular and respected website www.MinnesotaTriNews.com.
Its All about Performance
But, the problem — similar to a triathlete who plateaus in their swim/bike/run speed at this point in the racing season — is that Jerry’s website may have recently “plateaued” in response time and in order to continue to improve is likely in need of some ongoing response time and performance monitoring.
Notably, as the summer racing season had moved on and the number of advertising .gifs and .jpgs of lycra-clad triathletes on the website grew, website response time has correspondingly sloooow-ed. And finally, after an especially busy July 18-19 weekend of triathlon announcing, posting race re-caps and pictures, website response time was literally crawling across the finish line, so to speak.
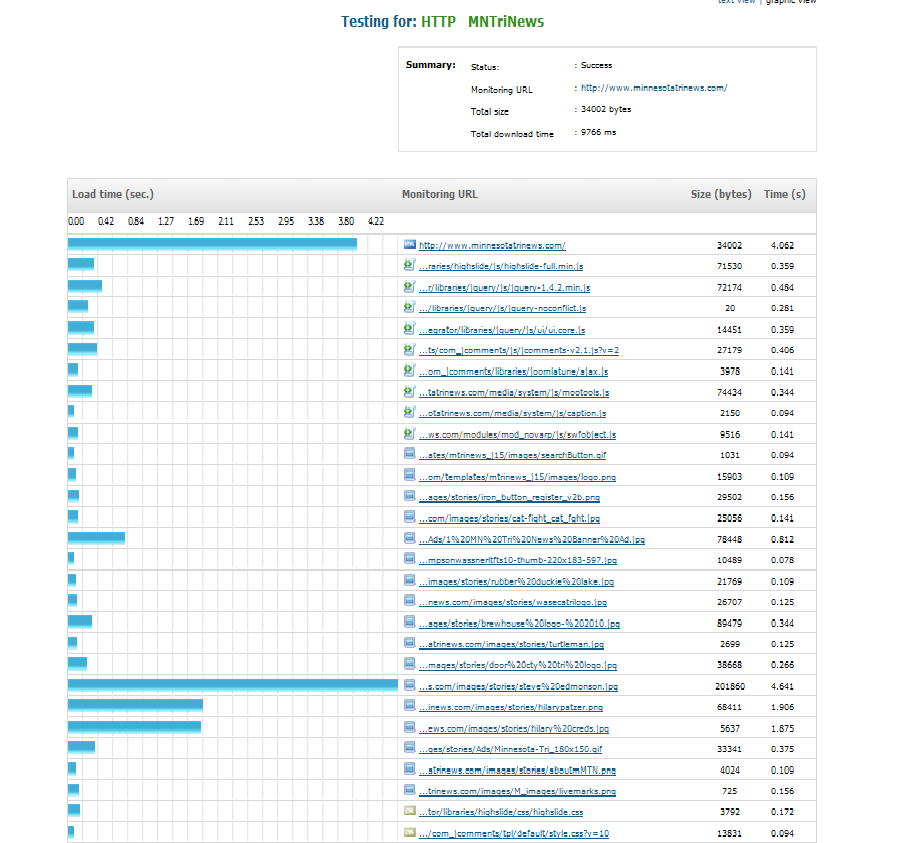
So, as I’m active in the Twin Cities triathlon world and wanted to have a better experience reading out this past weekend’s racing, I ran some full page download website monitoring tests and sent Jerry a quick email with a snapshot of his page elements’ response times using Dotcom-Monitor’s recently enhanced waterfall chart report tool to help him improve his site speed. In addition, I ran a keyword validation to monitor the web pages, which can be seen in detail at the keyword validation on our Wiki.
Triathletes are masters at identifying tiny aspects of their racing for increasing their speed (see minutiae on swim-to-bike transition tips here). Similarly, on a dynamic and continually updated website like www.MinnesotaTriNews.com monitoring page element response times is especially important in order to tweak the site as necessary to maintain fast response times. Following a race weekend triathletes start logging into a website like Jerry’s on Monday morning to check on race results and updates and anecdotes on triathlon races. As might be expected they expect the website to have cool pictures and ads for triathlete stuff, but as may be expected they also want the website to be FAST.
Uptime is Not Response Time
While uptime remained at 100%, the response time trended slower and slower during peak daytime hours. Specifically, the individual page elements were also running slower due to two new images recently added to the website over the weekend and a large JavaScript. In other words, every things was working perfectly…but slowly, due to the addition of the type of web content (specifically, the two large image files) that the users went to the website to see in the first place.
To Add the Lycra Pic or Not to Add the Lycra
The inherent tension between providing the users what they want (pictures of Lycra-clad triathletes) and maintaining fast response times on a rapidly changing site so users don’t leave is ongoing. Therefore, this is precisely the scenario where where ongoing full page download website monitoring can make a difference between ensuring a fast and successful website like www.MinnesotaTriNews.com stays successful, and a not website that is — as triathletes say when they run out of energy during a triathlon — “a death march.”
– Website Monitoring, Waterfall Charts, & Webpages of the Lycra-clad –


